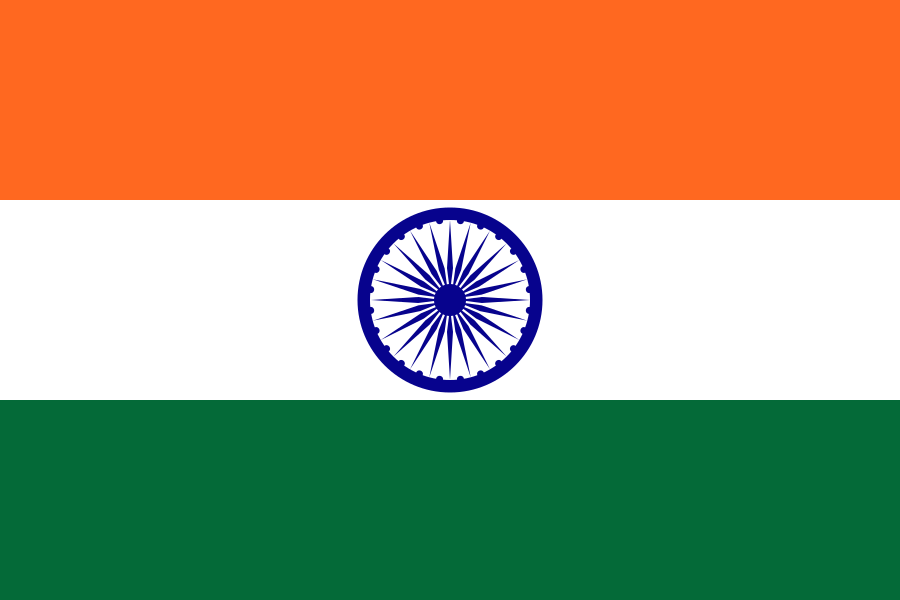
India at a glance
- Across 640 districts, India runs from 71.6 to 135.9 men per 100 women aged 20–39.
- 43 sit at 115 or above and 64 at 95 or below.
- Summed across every district on this page the figure is 103.4; the published national figure is 109.4 (different source and vintage).
Every line is computed from the district table below. Green cells hold more women per man aged 20–39.
The map
Every state or union territory in India, shaded by men per 100 women aged 20–39. Green holds more women, red more men.
94 or fewer112 or more men per 100 women
Most women-heavy districts
Lowest men-per-100-women, 20–39. 30 of 640 with at least 300 people in the band, sortable by any column.
| Mahe | Puducherry | 71.6 | 42k |
|---|---|---|---|
| Hamirpur | Himachal Pradesh | 77.1 | 455k |
| Almora | Uttarakhand | 77.2 | 622k |
| Rudraprayag | Uttarakhand | 78.1 | 242k |
| Bageshwar | Uttarakhand | 78.6 | 260k |
| Garhwal | Uttarakhand | 79.5 | 686k |
| Kannur | Kerala | 80.6 | 2.5M |
| Kurung Kumey | Arunanchal Pradesh | 81 | 92k |
| Tehri Garhwal | Uttarakhand | 82 | 618k |
| Ratnagiri | Maharashtra | 82.1 | 1.6M |
| Kozhikode | Kerala | 82.3 | 3.1M |
| Malappuram | Kerala | 82.7 | 4.1M |
| Kollam | Kerala | 83.3 | 2.6M |
| Pathanamthitta | Kerala | 84.2 | 1.2M |
| Thrissur | Kerala | 84.7 | 3.1M |
| Kasaragod | Kerala | 85 | 1.3M |
| Jaunpur | Uttar Pradesh | 86 | 4.4M |
| Gopalganj | Bihar | 86.2 | 2.6M |
| Alappuzha | Kerala | 86.4 | 2.1M |
| Azamgarh | Uttar Pradesh | 87.2 | 4.6M |
| Deoria | Uttar Pradesh | 87.3 | 3.1M |
| Udupi | Karnataka | 87.6 | 1.2M |
| Thiruvananthapuram | Kerala | 87.8 | 3.3M |
| Pithoragarh | Uttarakhand | 87.9 | 483k |
| East Kameng | Arunanchal Pradesh | 88.7 | 79k |
| Kangra | Himachal Pradesh | 88.8 | 1.5M |
| Ariyalur | Tamil Nadu | 90 | 754k |
| Perambalur | Tamil Nadu | 90.4 | 565k |
| Thanjavur | Tamil Nadu | 90.5 | 2.4M |
| Palakkad | Kerala | 90.8 | 2.8M |
Most men-heavy districts
Highest men-per-100-women, 20–39. 30 of 640 with at least 300 people in the band. Units housing an institution (prison, barracks, camp) read high here; the figure is correct, the dating signal is not.
| Daman | Daman & Diu | 235.8 | 191k |
|---|---|---|---|
| Tawang | Arunanchal Pradesh | 201 | 50k |
| Leh(Ladakh) | Jammu & Kashmir | 194 | 133k |
| North District | Sikkim | 155.4 | 44k |
| Dadra & Nagar Haveli | Dadara & Nagar Havelli | 149.3 | 343k |
| Kinnaur | Himachal Pradesh | 149.1 | 84k |
| Kargil | Jammu & Kashmir | 145.7 | 141k |
| Nicobars | Andaman & Nicobar Island | 140.4 | 37k |
| Kupwara | Jammu & Kashmir | 135.9 | 869k |
| Surat | Gujarat | 134.9 | 6.0M |
| Dibang Valley | Arunanchal Pradesh | 134.5 | 8k |
| West Kameng | Arunanchal Pradesh | 134.3 | 84k |
| Anjaw | Arunanchal Pradesh | 133.7 | 21k |
| Mumbai | Maharashtra | 133.6 | 3.1M |
| New Delhi | NCT of Delhi | 123.7 | 142k |
| Chandigarh | Chandigarh | 123.5 | 1.1M |
| Lahul & Spiti | Himachal Pradesh | 123.2 | 31k |
| Mumbai Suburban | Maharashtra | 121.9 | 9.3M |
| Rajouri | Jammu & Kashmir | 121.2 | 641k |
| East District | Sikkim | 119.4 | 283k |
| Hamirpur | Uttar Pradesh | 119.3 | 1.1M |
| Udhampur | Jammu & Kashmir | 119.2 | 555k |
| Kanpur Dehat | Uttar Pradesh | 117.8 | 1.8M |
| Baramula | Jammu & Kashmir | 117.7 | 1.0M |
| Jaisalmer | Rajasthan | 117.5 | 669k |
| Ganderbal | Jammu & Kashmir | 117.3 | 297k |
| South West | NCT of Delhi | 117.1 | 2.3M |
| Dhaulpur | Rajasthan | 116.9 | 1.2M |
| Bhind | Madhya Pradesh | 116.8 | 1.7M |
| Banda | Uttar Pradesh | 116.7 | 1.8M |
By State or Union Territory
Every state or union territory in India, aggregated from the districts above.
| Districts | |||
|---|---|---|---|
| Kerala | 86.9 | 33M | 14 |
| Puducherry | 91.4 | 1.2M | 4 |
| Tamil Nadu | 96.1 | 72M | 32 |
| Manipur | 97.7 | 2.8M | 9 |
| Andhra Pradesh | 98 | 84M | 23 |
| Uttarakhand | 98.3 | 10M | 13 |
| Meghalaya | 98.5 | 3.0M | 7 |
| Odisha | 98.8 | 42M | 30 |
| Himachal Pradesh | 99.1 | 6.9M | 12 |
| Assam | 99.2 | 31M | 27 |
| Chhattisgarh | 100.6 | 26M | 18 |
| Mizoram | 100.7 | 1.1M | 8 |
| Karnataka | 101.7 | 61M | 30 |
| West Bengal | 102 | 91M | 19 |
| Tripura | 102.9 | 3.7M | 4 |
| Jharkhand | 102.9 | 33M | 24 |
| Nagaland | 103 | 2.0M | 11 |
| Bihar | 103.2 | 104M | 38 |
| Arunanchal Pradesh | 104.2 | 1.4M | 16 |
| Goa | 106.1 | 1.5M | 2 |
| Rajasthan | 106.2 | 68M | 33 |
| Uttar Pradesh | 106.2 | 198M | 71 |
| Punjab | 106.9 | 28M | 20 |
| Madhya Pradesh | 107.2 | 73M | 50 |
| Maharashtra | 107.8 | 112M | 35 |
| Lakshadweep | 107.9 | 64k | 1 |
| Gujarat | 109.4 | 60M | 26 |
| Haryana | 110.6 | 25M | 21 |
| Jammu & Kashmir | 112.6 | 13M | 22 |
| NCT of Delhi | 113.3 | 17M | 9 |
| Andaman & Nicobar Island | 113.3 | 380k | 3 |
| Sikkim | 114.9 | 609k | 4 |
| Chandigarh | 123.5 | 1.1M | 1 |
| Dadara & Nagar Havelli | 149.3 | 343k | 1 |
| Daman & Diu | 205.1 | 243k | 2 |
Census age-by-sex counts. Data updated August 6, 2026. A ratio is a supply number, not a measure of dating success.
Put India on the board
Ratio, cost and visa side by side with every other market we measure. Free, no sign-in.
Open India in the research deskOr unlock the India deep-dive: the interactive district map, the dating-pool model, visa and tax.
Data updated