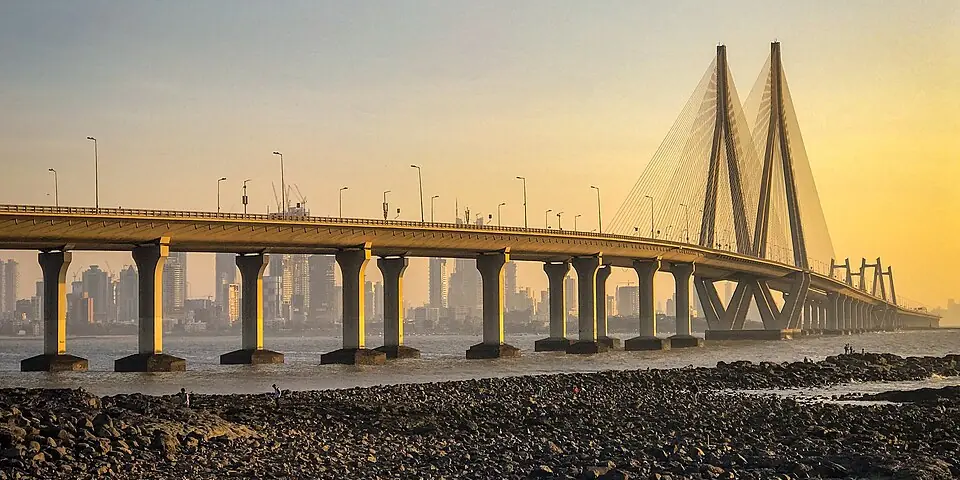

Mumbai is the most expensive of India's 10 priced cities — $593 a month in essentials, 139% above Kochi at $248. The average net salary of $776 covers that 1.3×. 121.9 men per 100 women aged 20–39, measured at district level. PM2.5 averages 35.2 µg/m³ a year, 7× the WHO guideline of 5. Jan averages 24°C, May 30°C.
Monthly cost breakdown
Rent outside centre plus utilities, groceries, dining and local transport make up the essentials figure. Not a full lifestyle budget.
| Item | Monthly USD |
|---|---|
| Rent, 1-bed outside centre | $353 |
| Rent, 1-bed city centre | $645 |
| Groceries | $52 |
| Dining out | $110 |
| Utilities | $70 |
| Local transport | $8 |
| Essentials / mo | $593 |
| Avg net salary | $776 |
| Rent, 3-bed outside centre | $844 |
| Rent, 3-bed city centre | $1,990 |
Single person, USD. Data updated July 29, 2026.
Everyday prices
What single items cost in Mumbai, in USD. The monthly figures above are built from these.
Eating out
| Item | USD |
|---|---|
| Meal, inexpensive restaurant | $5.22 |
| Meal for 2, mid-range, three courses | $20.90 |
| McMeal at McDonald's | $4.18 |
| Cappuccino, regular | $2.77 |
| Domestic beer, 0.5 L draught | $2.61 |
| Imported beer, 0.33 L bottle | $4.18 |
| Coke/Pepsi, 0.33 L | $0.41 |
| Water, 0.33 L bottle | $0.14 |
Groceries
| Item | USD |
|---|---|
| Milk, 1 L | $0.69 |
| White bread, 500 g | $0.51 |
| White rice, 1 kg | $0.74 |
| Eggs, 12 | $0.98 |
| Local cheese, 1 kg | $5.61 |
| Chicken fillets, 1 kg | $3.55 |
| Apples, 1 kg | $2.37 |
| Bananas, 1 kg | $0.74 |
| Tomatoes, 1 kg | $0.55 |
| Potatoes, 1 kg | $0.36 |
| Onions, 1 kg | $0.41 |
| Water, 1.5 L bottle | $0.29 |
Transport & bills
| Item | USD |
|---|---|
| One-way ticket, local transport | $0.21 |
| Monthly transit pass | $5.49 |
| Taxi start | $0.31 |
| Taxi, 1 km | $0.31 |
| Gasoline, 1 L | $1.11 |
| Basic utilities, 85 m² flat | $60.17 |
| Internet, 60 Mbps+ | $9.45 |
| Mobile plan, monthly | $4.48 |
Leisure
| Item | USD |
|---|---|
| Gym, monthly | $25.97 |
| Cinema, one seat | $4.18 |
Dating-age sex ratio
Mumbai has 121.9 men per 100 women aged 20–39 (district level). That is the highest of the 10 India cities we track. India's national figure is 109.4, so Mumbai runs 12 above the country as a whole.
A supply figure, 20–39. The dating-pool model is in Pro.
Climate & air
Ten-year monthly means, 2015–2024 — a climate profile, not a forecast.
| Month | Avg | Feels | Humidity | Cloud | Rain |
|---|---|---|---|---|---|
| Jan | 23.8°C | 25.2°C | 67% | 15% | 2 mm |
| Feb | 25.1°C | 26.9°C | 65% | 14% | 1 mm |
| Mar | 27.2°C | 30.2°C | 67% | 16% | 2 mm |
| Apr | 28.9°C | 33.7°C | 73% | 20% | 0 mm |
| May | 30°C | 35.6°C | 75% | 31% | 20 mm |
| Jun | 28.8°C | 33.7°C | 83% | 78% | 390 mm |
| Jul | 27.3°C | 31.6°C | 88% | 93% | 703 mm |
| Aug | 27°C | 31.3°C | 88% | 87% | 481 mm |
| Sep | 27.3°C | 32.4°C | 86% | 80% | 439 mm |
| Oct | 28.2°C | 33.3°C | 79% | 47% | 88 mm |
| Nov | 27°C | 30.1°C | 69% | 28% | 8 mm |
| Dec | 25.2°C | 27.3°C | 68% | 29% | 9 mm |
Need the full India model?
Open the gated deep-dive for city shortlist, cost detail, weather, visa, tax, dating-market signals, and subregion rankings.
Unlock India deep-dive