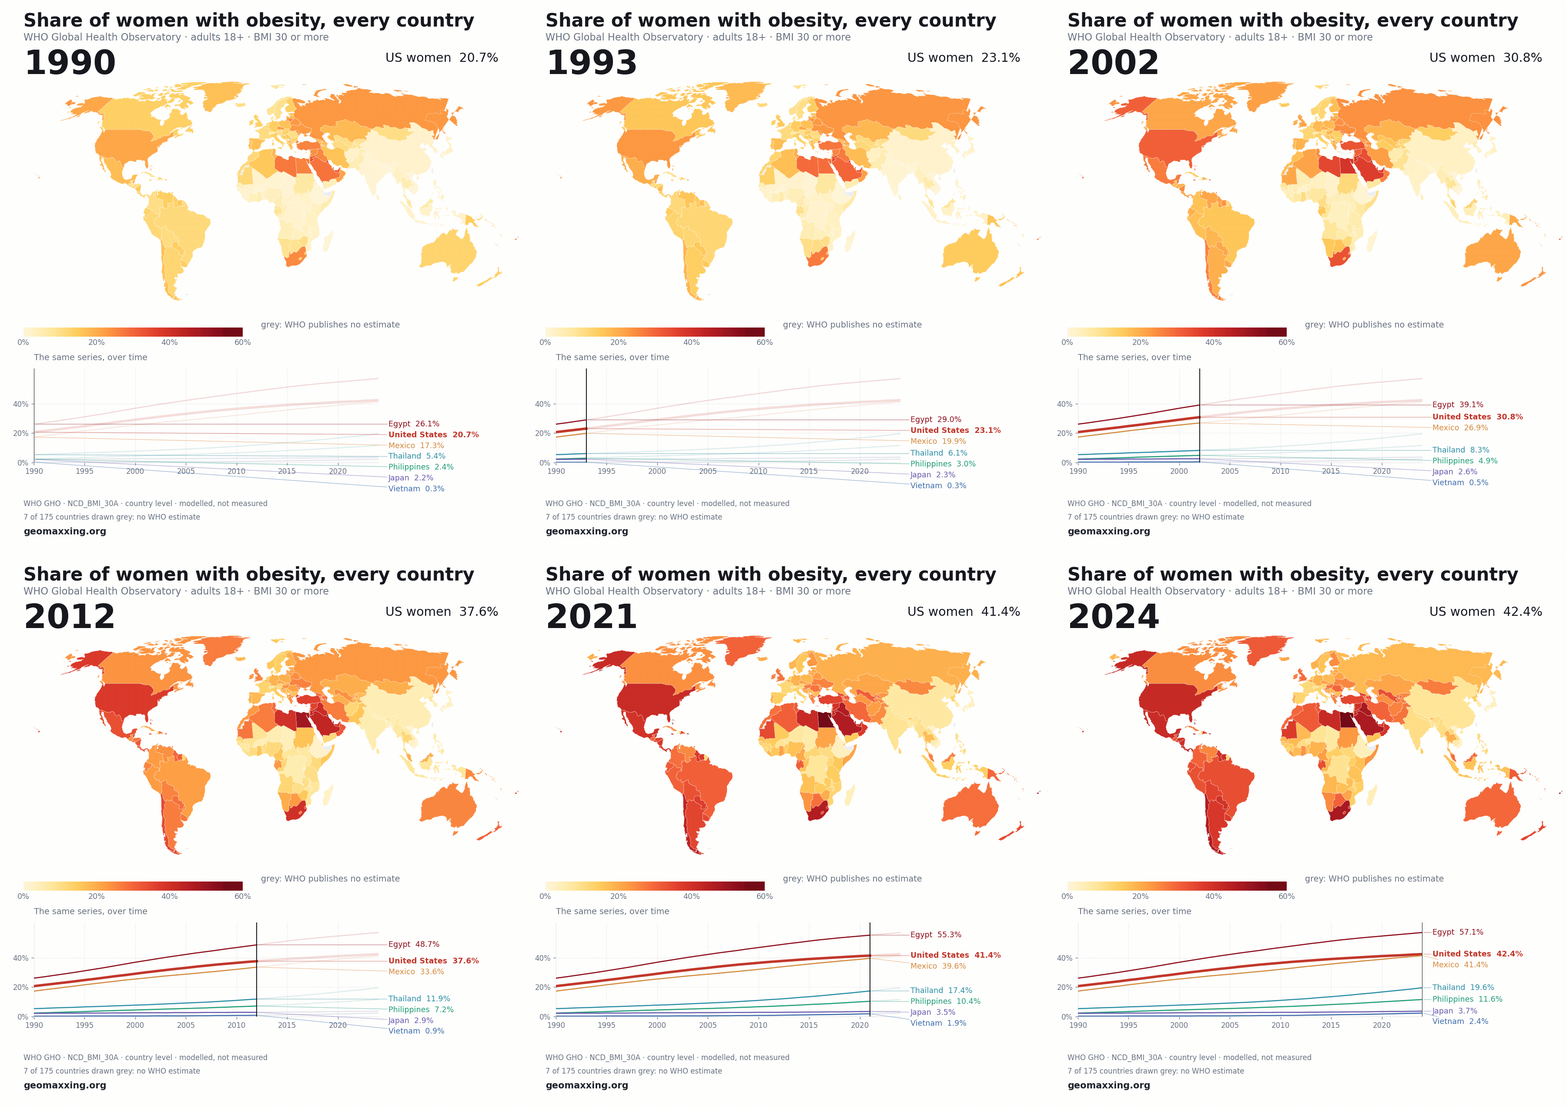
US women were 20.7% obese in 1990. They are 42.4% now.
Every country the WHO publishes an estimate for, one frame per year, 1990 to 2024. 156 of the 162 with a full series and a shape on the map rose.
Pale is a low share, deep red a high one, on one fixed 0–60% scale for all 35 frames. Grey countries are ones the WHO publishes no estimate for.
Five things in the loop
- The US figure doubled. 20.7% to 42.4%, +21.7 points in 34 years.
- It did not just keep pace. The US went from 22nd of 162 countries to 13th. It got worse relative to the field.
- 156 of 162 rose. The six that fell are Russia, Lithuania, Spain, Moldova, Belarus and Italy. All six are in Europe.
- Twelve countries are now above the US. None of them is European. Egypt, the Bahamas, Belize, Jamaica, Qatar, Fiji, Iraq, South Africa, Kuwait, Saudi Arabia, Chile, Panama. The heaviest country in Europe is Romania at 30.0%, still 12.4 points below the US.
- The spread dwarfs the trend. Egypt 57.1%, Vietnam 2.4%: a 54.7-point gap in one year, against a 21.7-point US move over 34.
“They are catching up”
True on the rate: the fastest multiples on Earth are Asian, Bangladesh 21.5×, Nepal 20.6×, India 9.5×. Not true on the level. Vietnam multiplied by eight and arrived at 2.4%, against 42.4%. Push the Philippines forward from 11.6% and the answer is 2052 compounding at 4.7% a year or 2138 adding 0.27 points a year: 86 years apart, and neither is a forecast.
The countries people actually shortlist
| Country | 1990 | 2024 | Change | Multiple |
|---|---|---|---|---|
| United States | 20.7% | 42.4% | +21.7 | 2.0× |
| Egypt | 26.1% | 57.1% | +31.0 | 2.2× |
| Chile | 16.5% | 46.4% | +29.9 | 2.8× |
| Mexico | 17.3% | 41.4% | +24.1 | 2.4× |
| Argentina | 12.6% | 38.4% | +25.8 | 3.0× |
| Dominican Republic | 11.4% | 37.2% | +25.8 | 3.3× |
| Georgia | 17.2% | 36.1% | +18.9 | 2.1× |
| Brazil | 11.4% | 33.9% | +22.5 | 3.0× |
| Peru | 12.0% | 33.3% | +21.3 | 2.8× |
| Colombia | 10.4% | 30.7% | +20.3 | 3.0× |
| Romania | 10.3% | 30.0% | +19.7 | 2.9× |
| Morocco | 11.7% | 29.9% | +18.2 | 2.6× |
| Australia | 13.0% | 29.7% | +16.7 | 2.3× |
| United Kingdom | 13.5% | 28.9% | +15.4 | 2.1× |
| Ukraine | 22.9% | 25.5% | +2.6 | 1.1× |
| Canada | 14.0% | 24.4% | +10.4 | 1.7× |
| Kazakhstan | 17.7% | 21.2% | +3.5 | 1.2× |
| Thailand | 5.4% | 19.6% | +14.2 | 3.6× |
| Poland | 16.6% | 17.6% | +1.0 | 1.1× |
| Kenya | 3.4% | 16.8% | +13.4 | 4.9× |
| Indonesia | 2.3% | 16.6% | +14.3 | 7.2× |
| Philippines | 2.4% | 11.6% | +9.2 | 4.8× |
| India | 1.1% | 10.4% | +9.3 | 9.5× |
| China | 1.9% | 8.4% | +6.5 | 4.4× |
| South Korea | 2.1% | 6.0% | +3.9 | 2.9× |
| Japan | 2.2% | 3.7% | +1.5 | 1.7× |
| Vietnam | 0.3% | 2.4% | +2.1 | 8.0× |
Sort any column. The CSV carries all 199 countries, 35 years, 6,965 rows; the 162 counted above are those with a 1990 value, a 2024 value and a shape on the map.
Every row above is a national figure for adults 18+. A country is not a market: Pro is the Geomaxxing Score and rank across 780 cities, the dating-pool model, and all 84 country deep-dives.
Not ready for that? Sort the free city table on ratio, cost and safety instead.
Where this is wrong
- Adults 18+, not a dating band. The site works in 20–39 everywhere else. These numbers are not that.
- Modelled, not measured. Pooled from national surveys, so a country with few surveys is carrying the model's prior. Worst where the map is palest.
- National. Every value here is a country figure. There is no city-level obesity series, and putting one on a city would be inventing it.
- 7 of 175 countries are grey — Taiwan, Kosovo and five others the WHO does not publish. Tonga, the global maximum at 81.4%, has no polygon at this resolution, which is why the scale stops at 60%.
WHO Global Health Observatory, NCD_BMI_30A, women 18+, country level, 1990–2024. Boundaries Natural Earth, Robinson projection. Full provenance: methodology. Same series, static: the USA against every destination.
More charts
Every city on the site, sortable on ratio, surplus, cost and safety. Free, no account needed to look.
The Pro deep-dives add the Geomaxxing Score, the dating-pool model and all 84 countries.